17 December 2012, the San Francisco Chronicle had a story—”Solar Power Adds to Non-Users’ Costs“—that provides background for a very good Microeconomics test question:
Q: Under what circumstances can the combination of a decrease in demand and an increase in supply lead to an increase in prices?
The short answer, of course, is, “When government interferes with the market process.”
If you are required to show your work, here’s what you do:
First, note that the own-price demand elasticity for electricity tends to be low for most consumers, meaning that one tends to consume the same quantity, seemingly regardless of the price. For example, one would not expect someone to throw open the windows in the middle of summer, with the air conditioner turned to its lowest setting, if the price of electricity fell substantially. More likely one would continue to consume electricity at approximately the same rate and use the cost savings on something that had a higher own-price elasticity of demand, like those things that collect in one’s shopping cart at Amazon.com, but one rarely gets around to ordering for delivery.
You can illustrate it this way:
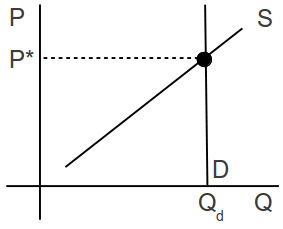
Fig. 1 : Vertical Demand Curve in Equilibrium
This is very similar to the textbook Supply & Demand graph, but with the Demand curve at the same quantity demanded for every price. (Of course, this is not realistic for all prices, and the real world is not so well-behaved. Such is the nature of economic models.)
As indicated in the article above, the increase in solar panels being installed on the roofs of residential and commercial buildings in California is causing a decrease in overall demand for conventional electricity.
In an unregulated market, we might illustrate it this way:
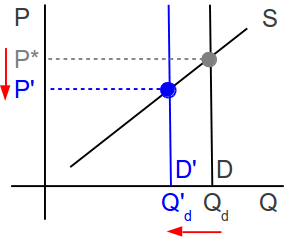
Fig. 2 : Vertical Demand Curve with Shift in Demand
As the demand decreases, due to the existence of solar-powered substitutes, price tends to fall. In an unregulated market, executives and shareholders in waning industries receive signals in the form of accumulating inventories—unsold output—that they either should reduce their prices, reduce their output, or both. If the trend continues—as happened with sailing ships, tools for making whale oil, steam locomotives, buggy whips, etc. in earlier generations—the executives and shareholders receive signals that they should consider whether liquidating and reallocating their existing resources might be more profitable than clinging to a dying firm or industry. (Schumpeter referred to this as ‘creative destruction‘.)
However, in a regulated market, suppliers and regulators agree on a price and fix it ex ante. Typically, the price is below the equilibrium, at least in the first iteration, so that consumers will be happy and express their gratitude to the politicians who oversee the regulators. (This sometimes is referred to as ‘the iron triangle‘ of regulation, and it is related to the concept of ‘regulatory capture‘.)
We can illustrate it this way:
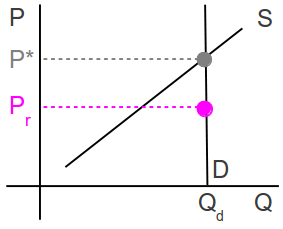
Fig. 3 : Vertical Demand Curve with Regulated Price
Here, the regulated price (Pr) is below the equilibrium price that would clear the market, but is at least as high as is needed to generate sufficient revenues to cover the costs of production. The executives and shareholders of regulated firms generally are rewarded for their cooperation with monopoly rights in the form of franchises that grant them the exclusive right to serve a particular geographic region.
The firm’s total revenue is illustrated as area of the pink rectangle below, which is price * quantity. It is possible that a firm’s executives and shareholders might want to increase output, so that the firm could sell the excess into neighboring markets, but the jurisdictions of most regulated industries do not adjoin jurisdictions where competitors are unregulated. Most likely, every neighboring territory is served by a different monopolist franchisee.
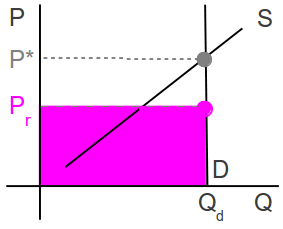
Fig. 4 : Vertical Demand Curve with Regulated Price / Total Revenue
Returning to Fig. 2, as solar panels reduce demand for conventional electricity, the demand curve shifts to the left.
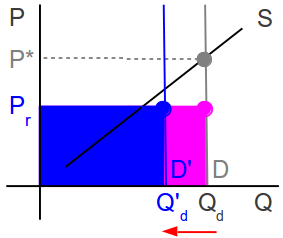
Fig. 5 : Vertical Demand Curve with Regulated Price and Demand Shift
Because the electricity providers’ prices are fixed by regulation, and they have very high fixed costs, they are loath to lower their prices. In fact, the fixed costs of maintaining a capital base that consists of indivisible centralized facilities, power lines, poles and waterproof underground conduits, substations, and other large and expensive infrastructure can vastly exceed the variable costs of fuel and peak-time labor, and these large fixed costs are the primary drivers of the price that suppliers and regulators agreed to previously.
Now, with a smaller consumer base, the utility operators have fewer customers to divide their fixed costs among. In order to arrive at a rectangle with the same area as the pink one in Fig. 4, given that the utility operators not only cannot force consumers to buy conventional electricity, but are required to buy the excess electricity produced by the owners of the solar panels. In other words, the suppliers are doubly pinched, and their only savings are in the form of electricity purchased at full retail from their customers, accompanied by a relatively slight decrease in variable fuel costs.
The only viable alternative in this situation is for the operators of the regulated conventional electricity utilities to petition the regulators for a price increase to be passed along to the remaining conventional electricity consumers.
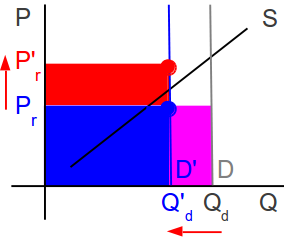
Fig. 6 : Vertical Demand Curve with Regulated Price / Price Increase
Considering that solar energy becomes more economically viable, when its primary competitor—conventional electricity—becomes more expensive, the rising prices in this scenario create an incentive for even more consumers to adopt solar energy, thereby shifting the demand curve even further leftward toward zero… creating yet more upward price pressure.
And, in this way, regulation creates an environment, in which a decrease in demand can lead to an increase in price.
Invest accordingly.
Prof. Evans
Conventional economics describes price as a function of demand. Therefore, the possibility of a negative relationship between the two is counter-intuitive to the model. Thus, we have a long drawn out explanation of a change in demand in this market causes a change in price. Perhaps, one might postulate another explanation: price is not always a function of demand, rather sometimes it is a function of gree…I mean regulation.
Perhaps equilibrium should not always be thought of as when supply meets demand, but rather when profit slightly exceeds shareholders demand.
Equilibrium applies only in the absence of monopoly power. Only in a monopolistic or oligopolistic market can suppliers arbitrarily constrict supply and charge prices above the marginal cost of production (i.e., the cost of producing the next unit of output).
Where large upfront costs create barriers to entry, one might see ‘natural’ monopoly. Think: pop stars, famous athletes, hydroelectric dams, etc.
Where competitors are blocked from the market by patent, copyright, or franchise, one sees government—’unnatural’—monopoly.
A business model that is potentially very lucrative is to supply substitutes for monopoly goods and undercut the monopolists’ prices just enough to steal the wind from their sails.